Load Testing
- How It Works
- Prerequisites
- Setting Up Your Project
- Writing Tests for Load Testing
- Starting and Stopping the Server
- Recording Tests
- Converting HAR Files
- Running Load Tests
- Realistic User Simulation
- Load Test Helper
- Full Maven Configuration Example
- Remote Load Testing
|
Note
|
Commercial Feature
A commercial Vaadin subscription is required to use TestBench in your project. |
Vaadin provides a Maven plugin that converts TestBench end-to-end tests into k6 load tests. This allows you to reuse your existing E2E tests as realistic user scenarios for performance testing, without writing separate load test scripts.
The plugin records browser traffic from TestBench tests, converts it into k6 scripts, and handles Vaadin-specific details such as session management, CSRF (Cross-Site Request Forgery) tokens, and push communication. The generated scripts can then be run with k6 against any server.
How It Works
The load testing workflow has three stages:
-
Record — A TestBench test runs through a recording proxy that captures all HTTP traffic as a HAR (HTTP Archive) file, a standard JSON format for recording browser network activity.
-
Convert — The HAR file is converted into a k6 script, with Vaadin-specific refactoring applied: dynamic session ID extraction, CSRF token handling, UI and Push ID management, and configurable target server. Form input values are extracted into a CSV data file for per-user variation.
-
Run — The k6 script is executed with a configurable number of virtual users and duration against a target server.
The plugin uses pure Java utilities. No Node.js is required.
Prerequisites
The following tools are needed:
-
Java 21+
-
Maven 3.9+
-
k6 — Install from Grafana k6 documentation. On macOS:
brew install k6. -
Chrome — Latest version, with ChromeDriver.
-
TestBench — Existing end-to-end tests.
Setting Up Your Project
Add the plugin to your Maven project:
Source code
XML
<plugin>
    <groupId>com.vaadin</groupId>
    <artifactId>testbench-converter-plugin</artifactId>
    <version>${vaadin.version}</version>
</plugin>
Add the load test helper as a test dependency. It provides LoadTestItHelper for proxy driver configuration in your tests:
Source code
XML
<dependency>
    <groupId>com.vaadin</groupId>
    <artifactId>loadtest-helper</artifactId>
    <scope>test</scope>
</dependency>
To enable the @Destructive annotation and automatic WebDriver cleanup during recording, add the load test support library as a test dependency:
Source code
XML
<dependency>
    <groupId>com.vaadin</groupId>
    <artifactId>testbench-loadtest-support</artifactId>
    <scope>test</scope>
</dependency>
This JUnit 5 extension auto-detects when the recording proxy is active and skips tests annotated with @Destructive. It also ensures the WebDriver is properly closed after each test to prevent orphaned browser processes during recording.
Writing Tests for Load Testing
Standard TestBench integration tests define user workflows. The same tests you use for functional verification can serve as load test scenarios. If you update your application or tests, the load tests are automatically updated on next recording.
In practice, you may want to select certain scenarios from your existing E2E test suite, or create dedicated scenarios that reuse your page object classes.
|
Note
|
Be aware that load test scenarios run many times concurrently across multiple virtual users. If a scenario modifies shared state — such as editing and saving a record in a database — subsequent runs may encounter different application state than the original E2E test expected. For example, a scenario that clicks a button to save a form may work the first time, but on the next run the button could be disabled (because the record was already modified), causing the test to fail or log a warning when the framework blocks the interaction. Design load test scenarios to be repeatable: prefer read-only workflows, use scenarios that create new data rather than editing existing records, or ensure the application state resets between runs. For test methods that modify shared state in ways that cannot be safely replayed, use the |
Proxy Configuration
During recording, the plugin captures HTTP traffic by routing the browser through a recording proxy. The browser driver must be configured to use this proxy. Without proxy configuration, the browser connects directly to the server and the plugin cannot capture traffic.
The LoadTestItHelper class (from the loadtest-helper dependency) handles proxy driver configuration. Its openWithProxy() method checks whether the k6.proxy.host system property is set. When it is, it replaces the current driver with one configured to route traffic through the recording proxy, including the necessary Chrome flags for MITM proxy support. When the property is not set, it navigates the existing driver to the given URL, so the tests run normally.
Create a base class for your load test scenarios that calls openWithProxy() in a @BeforeEach method. The getRootURL() helper builds the server base URL from the HOSTNAME environment variable (defaults to localhost) and the server.port system property (defaults to 8080):
Source code
Java
import com.vaadin.testbench.BrowserTestBase;
import com.vaadin.testbench.loadtest.LoadTestItHelper;
import org.junit.jupiter.api.BeforeEach;

public abstract class AbstractIT extends BrowserTestBase {

    @BeforeEach
    public void open() {
        String viewUrl = LoadTestItHelper.getRootURL()
                + "/" + getViewName();
        setDriver(LoadTestItHelper.openWithProxy(
                getDriver(), viewUrl));
    }

    abstract public String getViewName();
}
Test classes extend this base class and provide the view name and test logic:
Source code
Java
public class HelloWorldIT extends AbstractIT {

    @BrowserTest
    public void helloWorldWorkflow() {
        TextFieldElement nameField = $(TextFieldElement.class).first();
        nameField.setValue("Test User");

        $(ButtonElement.class).first().click();

        $(NotificationElement.class).waitForFirst();
    }

    @Override
    public String getViewName() {
        return "";  // Root path
    }
}
Excluding Destructive Tests
Some test methods modify shared state in ways that cannot be safely replayed by multiple virtual users (for example, deleting a specific entity). Annotate these methods with @Destructive to skip them during recording:
Source code
Java
@BrowserTest
@Destructive
public void deletePatient() {
    // This test is skipped during k6 recording
    // but runs normally in regular test execution
}
Starting and Stopping the Server
The k6:record and k6:run goals require the application server to be running. You can start and stop the server manually, or let the plugin manage it automatically using the k6:start-server and k6:stop-server goals.
The k6:start-server goal starts a Spring Boot executable JAR, waits for the health endpoint to respond, and stores the process handle in the Maven build context. The k6:stop-server goal retrieves that handle and shuts the server down gracefully.
Source code
XML
<execution>
    <id>start-server</id>
    <goals>
        <goal>start-server</goal>
    </goals>
    <configuration>
        <serverJar>${project.build.directory}/my-app.jar</serverJar>
        <serverPort>8081</serverPort>
        <managementPort>8082</managementPort>
    </configuration>
</execution>
By default, k6:start-server runs in the pre-integration-test phase and k6:stop-server runs in the post-integration-test phase, so the server lifecycle wraps around the recording and load test executions.
Start Server Parameters
k6.serverJar-
Path to the executable JAR file to start. Required.
k6.serverPort-
Application server port. Defaults to
8080. k6.managementPort-
Spring Boot Actuator management port. Defaults to
8082. k6.jvmArgs-
Extra JVM arguments (for example,
-Xmx512m). k6.appArgs-
Extra application arguments.
k6.startupTimeout-
Maximum time to wait for server startup, in seconds. Defaults to
120. k6.healthPollInterval-
Interval for polling the health endpoint, in seconds. Defaults to
2.
Recording Tests
The k6:record goal runs one or more TestBench test classes through a recording proxy, captures the HTTP traffic, and converts it into k6 scripts:
Source code
bash
mvn k6:record -Dk6.testClass=HelloWorldIT -Dk6.appPort=8080To record multiple tests:
Source code
bash
mvn k6:record -Dk6.testClasses=HelloWorldIT,CrudExampleITThe plugin uses hash-based caching: if the test source code has not changed since the last recording, the test is skipped. Use -Dk6.forceRecord=true to force re-recording.
Recording Parameters
k6.testClass-
TestBench test class to record. Required unless
k6.testClassesis specified. k6.testClasses-
Comma-separated list of test classes to record.
k6.proxyPort-
Port for the recording proxy. Defaults to
6000. k6.appPort-
Port where the application is running. Defaults to
8080. k6.testWorkDir-
Working directory for Maven test execution. Defaults to
${project.basedir}. k6.outputDir-
Output directory for generated k6 scripts. Defaults to
${project.build.directory}/k6/tests. k6.testTimeout-
Timeout for test execution, in seconds. Defaults to
300. k6.forceRecord-
Force re-recording even if test sources are unchanged. Defaults to
false.
Converting HAR Files
If you already have a HAR file (for example, recorded with browser developer tools), you can convert it directly into a k6 script without running a TestBench test:
Source code
bash
mvn k6:convert -Dk6.harFile=recording.harThe conversion pipeline:
-
Filters out requests to external domains (analytics, CDNs).
-
Generates a k6 script from the HAR entries.
-
Applies Vaadin-specific refactoring (session handling, configurable server address).
Conversion Parameters
k6.harFile-
Path to the HAR file to convert. Required.
k6.outputDir-
Output directory for the k6 script. Defaults to
${project.build.directory}/k6/tests. k6.outputName-
Output file base name. Defaults to a name derived from the HAR file.
k6.skipFilter-
Skip filtering external domain requests. Defaults to
false. k6.skipRefactor-
Skip Vaadin-specific session handling refactoring. Defaults to
false.
Running Load Tests
The k6:run goal executes k6 scripts with configurable virtual users and duration:
Source code
bash
mvn k6:run -Dk6.testFile=target/k6/tests/hello-world.js -Dk6.vus=50 -Dk6.duration=1mTo run all scripts in a directory:
Source code
bash
mvn k6:run -Dk6.testDir=target/k6/tests -Dk6.vus=50 -Dk6.duration=1mTo run against a remote server:
Source code
bash
mvn k6:run -Dk6.testFile=target/k6/tests/hello-world.js \
    -Dk6.appIp=staging.example.com -Dk6.appPort=8080 \
    -Dk6.vus=100 -Dk6.duration=5m
You can also run the generated scripts directly with k6:
Source code
bash
k6 run --vus 50 --duration 30s target/k6/tests/hello-world.js

# Against a different server
k6 run -e APP_IP=192.168.1.100 -e APP_PORT=8080 target/k6/tests/hello-world.js
Run Parameters
k6.testFile-
Single k6 test file to run.
k6.testFiles-
List of k6 test files to run.
k6.testDir-
Directory containing k6 test files. All
.jsfiles in the directory are executed. k6.vus-
Number of virtual users. Defaults to
10. k6.duration-
Test duration (for example,
30s,1m,5m). Defaults to30s. k6.appIp-
Target application IP address or hostname. Defaults to
localhost. k6.appPort-
Target application port. Defaults to
8080. k6.managementPort-
Spring Boot Actuator management port for server metrics. Defaults to
8082. k6.collectVaadinMetrics-
Enable Vaadin-specific server metrics collection via Actuator. Defaults to
false. k6.metricsInterval-
Interval for server metrics collection, in seconds. Defaults to
10. k6.failOnThreshold-
Fail the Maven build if k6 thresholds are breached. Defaults to
true. k6.combineScenarios-
Combine multiple test files into parallel scenarios with weighted virtual user distribution. Defaults to
false. k6.scenarioWeights-
Weights for combined scenarios (for example,
helloWorld:70,crudExample:30).
Combined Scenarios
When running multiple test files, you can combine them into parallel k6 scenarios with weighted virtual user distribution. This simulates realistic traffic where different user workflows happen concurrently:
Source code
XML
<configuration>
    <testDir>${project.build.directory}/k6/tests</testDir>
    <virtualUsers>100</virtualUsers>
    <duration>5m</duration>
    <combineScenarios>true</combineScenarios>
    <scenarioWeights>helloWorld:70,crudExample:30</scenarioWeights>
</configuration>
In this example, 70 virtual users execute the helloWorld scenario while 30 execute the crudExample scenario simultaneously.
Understanding k6 Output
After a run, k6 reports metrics:
Source code
     scenarios: (100.00%) 1 scenario, 50 max VUs, 1m30s max duration

     ✓ page load status equals 200
     ✓ vaadin init status equals 200
     ✓ valid init response
     ✓ UIDL request succeeded
     ✓ no server error
     ✓ no exception
     ✓ security key valid
     ✓ valid UIDL response

     http_req_duration..............: avg=45.23ms  min=12.34ms  max=234.56ms
     http_req_failed................: 0.00%  ✓ 0   ✗ 1234
     http_reqs......................: 1234   41.13/s
Key metrics:
-
http_req_duration — Response time (average, minimum, maximum).
-
http_req_failed — Percentage of failed requests.
-
http_reqs — Total requests and throughput (requests per second).
Realistic User Simulation
By default, the generated k6 scripts include think time delays to simulate actual user behavior. Without think times, virtual users send requests as fast as possible, which does not represent realistic traffic patterns.
-
Page read delay — 2 to 5 seconds after a page loads, simulating a user reading the page.
-
Interaction delay — 0.5 to 2 seconds between user actions, simulating thinking time.
The plugin analyzes HAR content to identify user actions (clicks, text input) and page loads, and inserts appropriate delays.
Configuring Think Times
Configure think times in the plugin configuration:
Source code
XML
<configuration>
    <!-- Enable or disable think times (default: true) -->
    <thinkTimeEnabled>true</thinkTimeEnabled>

    <!-- Base delay after page load in seconds (default: 2.0) -->
    <!-- Actual delay: baseDelay + random(0, baseDelay * 1.5) -->
    <pageReadDelay>2.0</pageReadDelay>

    <!-- Base delay after user interaction in seconds (default: 0.5) -->
    <!-- Actual delay: baseDelay + random(0, baseDelay * 3) -->
    <interactionDelay>0.5</interactionDelay>
</configuration>
Or via command line:
Source code
bash
# Disable think times for maximum throughput testing
mvn k6:record -Dk6.thinkTime.enabled=false

# Custom delays
mvn k6:record -Dk6.thinkTime.pageReadDelay=3.0 -Dk6.thinkTime.interactionDelay=1.0
Disable think times when you want to stress test the server at maximum request rate.
Randomized Form Input Data
When a recorded test interacts with form fields (text fields, text areas, and similar input components), the plugin extracts the submitted values and generates a CSV data file alongside the k6 script. For example, recording CrudExampleIT produces:
Source code
target/k6/tests/
├── crud-example-generated.js
└── crud-example-data.csv
The CSV file contains a header row with numbered input columns and one data row with the originally recorded values:
Source code
csv
input_1,input_2,input_3
Test User,test@example.com,Some text
The generated k6 script automatically loads this file using k6’s SharedArray and picks a random row on each iteration.
With only the single recorded row, every virtual user submits identical form data. To simulate realistic traffic with varied input, add more rows to the CSV file:
Source code
csv
input_1,input_2,input_3
Test User,test@example.com,Some text
Jane Smith,jane@example.com,Another message
Bob Johnson,bob@example.com,Different input
Each virtual user iteration selects a random row, reducing the impact of duplicate data on server-side caches and application state.
|
Note
| When using combined scenarios, each scenario’s CSV data is loaded with a unique namespace, so input columns from different scripts do not collide. |
Load Test Helper
The loadtest-helper library is a drop-in dependency that enhances your Vaadin application for load testing. It provides two features: error propagation (so k6 can detect server-side failures) and Vaadin-specific metrics (exposed via Spring Boot Actuator). It auto-registers via ServiceLoader — no code changes are needed.
The error handler and metrics features require the dependency with runtime scope so that it is deployed with the application:
Source code
XML
<dependency>
    <groupId>com.vaadin</groupId>
    <artifactId>loadtest-helper</artifactId>
    <scope>runtime</scope>
</dependency>|
Note
|
The project setup section shows loadtest-helper with test scope for using LoadTestItHelper in test code. If you also want error propagation and vaadin.view.count metrics at runtime, add the dependency a second time with runtime scope, or use the default (compile) scope to cover both cases. Only include the runtime dependency in builds used for load testing, as it changes error handling behavior.
|
Error Visibility
The generated k6 scripts include built-in validation checks that verify each server response:
-
init request succeeded — The initial page load returned HTTP 200.
-
valid init response — The init response contains a UI ID and security key.
-
session is valid — The response does not indicate an expired session.
-
security key valid — The CSRF security key was accepted.
-
UIDL request succeeded — Subsequent UIDL requests returned HTTP 200.
-
valid UIDL response — The UIDL response contains a valid sync ID.
-
no server error — The response does not contain an
appErrormeta field. -
no exception — The response body does not contain an exception.
If any check fails, k6 reports it in the test results.
By default, Vaadin catches server-side exceptions during request processing and shows a notification in the browser. The HTTP response remains a 200 with valid UIDL, which makes certain failures invisible to the checks above. The load test helper replaces the default error handler with one that re-throws exceptions, causing Vaadin to return an error meta response (for example, {"meta":{"appError":…}}) that the no server error and no exception checks can detect.
Server Metrics with Spring Boot Actuator
The load test helper tracks active Vaadin UIs and view instances, and exposes them as Micrometer gauges via Spring Boot Actuator. This allows you to monitor server-side state during load tests alongside k6 client-side metrics.
The following metrics are registered:
-
vaadin.view.count— Total number of active Vaadin UI instances. -
vaadin.view.count(tagged withview) — Number of active instances per view class (for example,view=MainView).
If Micrometer is not on the classpath, the helper still tracks UIs internally but does not expose metrics.
Enabling Actuator
To expose metrics, your application needs Spring Boot Actuator configured. Add the dependency if not already present:
Source code
XML
<dependency>
    <groupId>org.springframework.boot</groupId>
    <artifactId>spring-boot-starter-actuator</artifactId>
</dependency>
Configure Actuator to expose the metrics endpoint on a separate management port. This keeps metrics accessible to the load test plugin without exposing them on the application port:
Source code
properties
management.server.port=8082
management.endpoints.web.exposure.include=health,metrics
Collecting Metrics During Load Tests
The k6:run goal can collect server metrics from Actuator during the load test. It fetches CPU usage, memory, heap, active sessions, and Vaadin view counts at regular intervals and displays a summary after the test.
Enable metrics collection via the plugin configuration:
Source code
XML
<configuration>
    <managementPort>8082</managementPort>
    <collectVaadinMetrics>true</collectVaadinMetrics>
    <metricsInterval>10</metricsInterval>
</configuration>
Or via command line:
Source code
bash
mvn k6:run -Dk6.testDir=target/k6/tests \
    -Dk6.managementPort=8082 \
    -Dk6.collectVaadinMetrics=true \
    -Dk6.metricsInterval=10
The plugin collects a baseline before the load test starts, then samples metrics at the configured interval. After the test, it reports a time-series table with system metrics (CPU, heap, sessions) and per-view counts, along with summary statistics such as heap delta, session delta, and average/peak CPU usage.
Full Maven Configuration Example
Below is a complete example that starts the application server, records two TestBench scenarios, runs them as a combined load test, and stops the server:
Source code
XML
<plugin>
    <groupId>com.vaadin</groupId>
    <artifactId>testbench-converter-plugin</artifactId>
    <version>${vaadin.version}</version>
    <executions>
        <!-- Start the application server -->
        <execution>
            <id>start-server</id>
            <goals>
                <goal>start-server</goal>
            </goals>
            <configuration>
                <serverJar>${project.build.directory}/my-app.jar</serverJar>
                <serverPort>8081</serverPort>
                <managementPort>8082</managementPort>
            </configuration>
        </execution>

        <!-- Record TestBench scenarios -->
        <execution>
            <id>record-scenarios</id>
            <phase>integration-test</phase>
            <goals>
                <goal>record</goal>
            </goals>
            <configuration>
                <testClasses>
                    <testClass>HelloWorldIT</testClass>
                    <testClass>CrudExampleIT</testClass>
                </testClasses>
                <proxyPort>6000</proxyPort>
                <appPort>8081</appPort>
                <testWorkDir>${project.basedir}/../my-app</testWorkDir>
            </configuration>
        </execution>

        <!-- Run k6 load tests -->
        <execution>
            <id>run-load-tests</id>
            <phase>integration-test</phase>
            <goals>
                <goal>run</goal>
            </goals>
            <configuration>
                <testDir>${project.build.directory}/k6/tests</testDir>
                <virtualUsers>100</virtualUsers>
                <duration>2m</duration>
                <appPort>8081</appPort>
                <managementPort>8082</managementPort>
                <collectVaadinMetrics>true</collectVaadinMetrics>
                <combineScenarios>true</combineScenarios>
                <scenarioWeights>helloWorld:70,crudExample:30</scenarioWeights>
            </configuration>
        </execution>

        <!-- Stop the application server -->
        <execution>
            <id>stop-server</id>
            <goals>
                <goal>stop-server</goal>
            </goals>
        </execution>
    </executions>
</plugin>
Running mvn verify with this configuration executes the full workflow: start server, record scenarios, run load tests, and stop server.
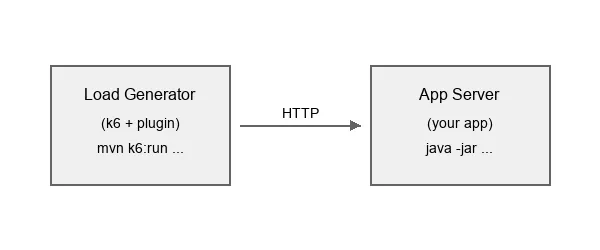
Remote Load Testing
For accurate performance metrics, run the load generator on a different machine than the application server:
Record tests on a development machine, then run against the target server:
Source code
bash
# Step 1: Record scenarios locally
mvn k6:record -Dk6.testClasses=HelloWorldIT,CrudExampleIT -Dk6.appPort=8081

# Step 2: Run against remote server
mvn k6:run -Dk6.testDir=target/k6/tests \
    -Dk6.appIp=staging.example.com -Dk6.appPort=8080 \
    -Dk6.vus=100 -Dk6.duration=5m
Best Practices
-
Use separate machines. Running the load generator and the application on the same machine skews results because they compete for CPU and memory.
-
Scale gradually. Start with a small number of virtual users and increase to find breaking points.
-
Use a stable network. For cloud testing, run the load generator in the same region as the application server.
-
Pre-record tests. Record on a development machine, then distribute the generated k6 scripts to the load generation environment.
-
Monitor the server. Enable Actuator metrics collection (
k6.collectVaadinMetrics=true) to correlate server health with k6 results.